Monitor your Windows Server
Last updated on
When you order a new managed server it will be provided with a monitoring functionality as a self service, which will be described in this tutorial. Please note that the monitoring of your new server won’t be enabled right from the beginning, it needs to be enabled additionally.
Enable monitoring
Section titled “Enable monitoring”Here you can perform all activities in regards to the monitoring of your server. Please take into account that you have to enter a valid email adress in order to be able to enable the monitoring.
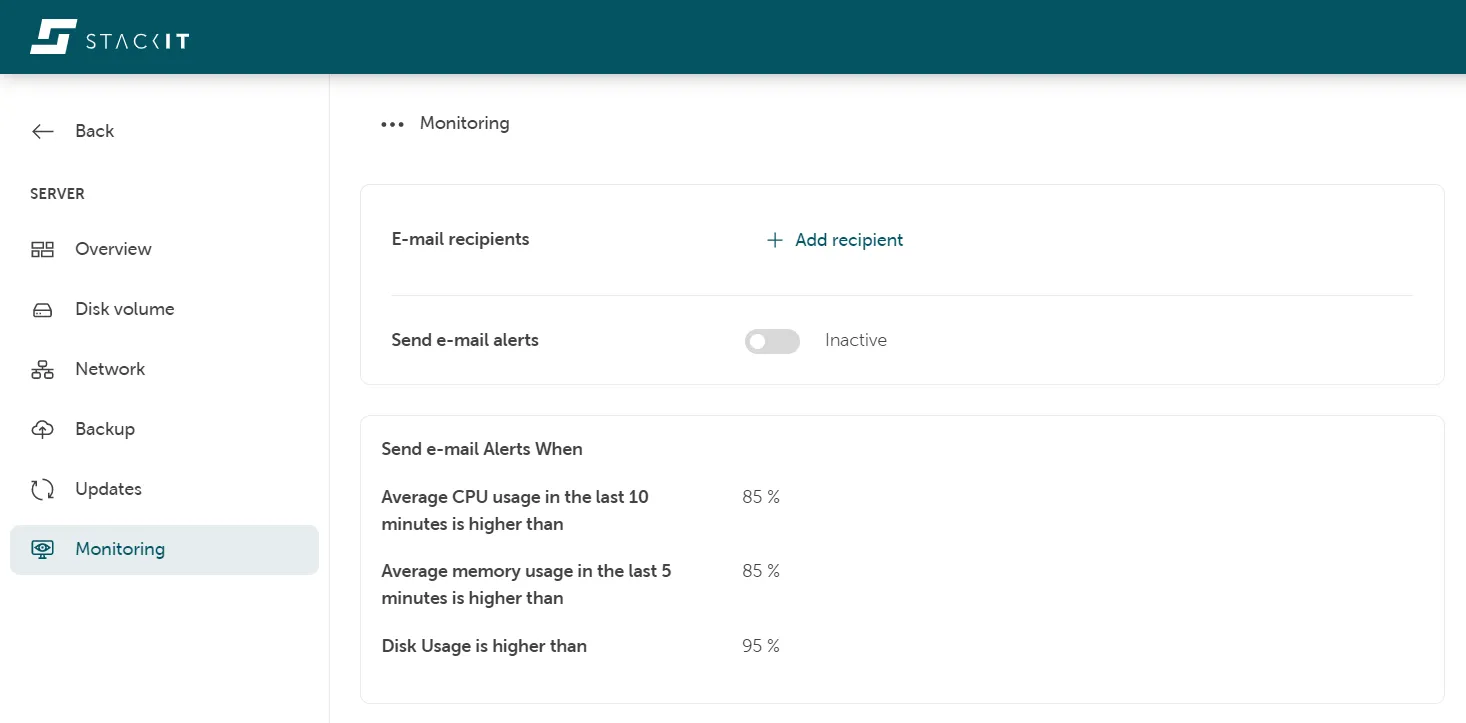
Predefined alerts
Section titled “Predefined alerts”The standard monitoring supports four alerts delivered by email which can be triggered when the following conditions are met:
| Type of Alert | Default values ( can be modified ) | Time needed for the condition to hold true |
|---|---|---|
| There is no data received for the last 10 minutes. Please check your server | N/A | 10 minutes |
| Average CPU usage in the last 10 minutes is higher than | 85% | 10 minutes |
| Average memory usage in the last 5 minutes is higher than | 85% | 5 minutes |
| Disk Usage is higher than | 95% | 5 minutes |
Telegraf Agent licensing
Section titled “Telegraf Agent licensing”Telegraf is used as the monitoring agent that provides the telemetry push data for Observability and is installed on every STACKIT managed Windows server that you order.
Please read the Telegraf license file for details about the Telegraf licensing model.