How to connect a metrics/logs/traces data source from another Observability Instance
Last updated on
Following tutorial explains how to connect
- metrics (Thanos)
- logs (Loki)
- traces (Tempo)
data source from one Observability instance into another.
Get URL of data source
Section titled “Get URL of data source”- Login to STACKIT Portal
- Choose the Observability Instance where you like to get the data source from.
- Open Service Dashboard and select API tab.
- Copy the relevant URL, for:
- Thanos:
https://storage.api.stackit.argus.eu01.stackit.cloud/... - Loki:
https://logs.stackit.argus.eu01.stackit.cloud/... - Tempo:
https://[part of instance-id]-tui.traces.stackit.argus.eu01.stackit.cloud/...part of instance-id = AAAAAAAA-BBBB-CCCC-DDDD-EEEEEEEEEEEE
- Thanos:
Create credentials
Section titled “Create credentials”Next step is to create credentials to access your data source.
- Choose the Observability Instance where you like to get the data source from.
- Create new credentials.
- Note username and password.
Setup new data source within Grafana
Section titled “Setup new data source within Grafana”- Choose the Observability Instance where you like setup the new data source.
- Login to Grafana and select Connections from the toggle menu.
- Choose Data sources and after that click on Add new data source.
- Select correct data source type:
- for Thanos choose Prometheus
- for Loki it’s Loki
- for Tempo it’s Tempo
- for Thanos choose Prometheus
- Set the name of your data source.
- At Connection you now have to fill the field URL.
- Combine now the credentials with URL of the data source.
- The URL format has to be: https://[username]:[password]@[data source]
- Example of a Thanos data source URL:
https://stackit5_2e2b79c6-5dcc-4492-...:supersecret@↵
storage.api.stackit5.argus.eu01.stackit.cloud↵
/instances/2e2b79c6-5dcc-4492-bb88-2e2b79c65dcc - Example of a Loki data source URL:
https://stackit5_2e2b79c6-5dcc-4492-...:supersecret@↵
logs.stackit5.argus.eu01.stackit.cloud↵
/instances/2e2b79c6-5dcc-4492-bb88-2e2b79c65dcc - Example of a Tempo data source URL:
https://stackit5_2e2b79c6-5dcc-4492-...:supersecret@↵
2e2b79c6-5dcc-tui.traces.stackit5.argus.eu01.stackit.cloud↵
/instances/2e2b79c6-5dcc-4492-bb88-2e2b79c65dcc 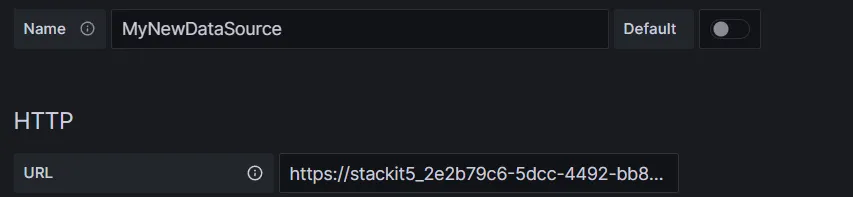
- Click on Save and test.
If everything is setup correct you now receive the message “Data source is working”.