How to push traces Observability
Last updated on
This guide explains the process of setting up application tracing, configuring the export via an OpenTelemetry Collector, and ensuring secure transmission to the STACKIT Observability Instance.
The Tracing Data Flow
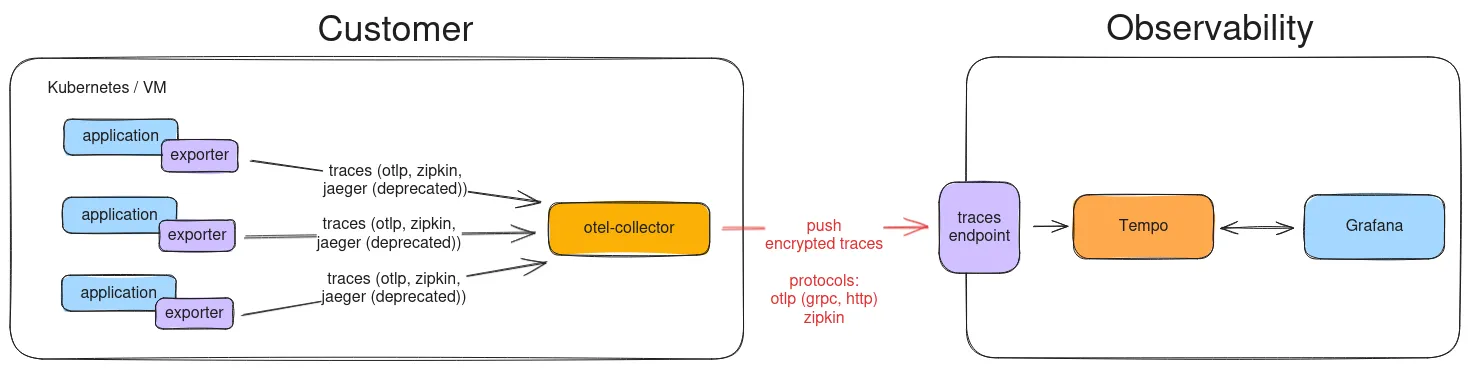
Section titled “The Tracing Data Flow”Traces follow a specific path from your application to the Tempo backend:
-
Application: Your code uses i.e. the OpenTelemetry (OTel) SDK/Exporter (often called “Agent”) to instrument operations (spans).
-
OTel Exporter: The application’s OTel Exporter sends these spans over the local network to the next component.
-
OpenTelemetry Collector (Recommended): The Collector receives the traces, batch-processes them, and applies secure authentication before forwarding them over the internet.
-
STACKIT Observability Endpoint (Tempo): The Collector pushes the traces to the specific Tempo ingestion endpoint in your STACKIT instance, where they are stored and indexed for querying.
This model allows your application to focus on its business logic while delegating security and reliable delivery to the Collector.
Integrating Tracing into Your Application
Section titled “Integrating Tracing into Your Application”To instrument your application, you must integrate the appropriate OpenTelemetry SDK for your programming language. This SDK captures the tracing data.
For detailed language-specific integration guides, please refer to the official OpenTelemetry documentation:
OpenTelemetry Language Documentation: https://opentelemetry.io/docs/languages/
Finding the Tracing Endpoint URL
Section titled “Finding the Tracing Endpoint URL”The endpoint URL is crucial for configuring your Collector or application’s Exporter. It directs the trace data to your specific Tempo instance.
You can find this URL in the STACKIT Portal:
-
Go to the STACKIT Portal:
https://portal.stackit.cloud -
Navigate to Logging & Monitoring.
-
Select Observability.
-
Choose your specific instance: INSTANCE_ID.
-
Go to the API tab.
-
Click on Info.
-
Find the dedicated URL under the section Traces.
This URL typically corresponds to the OTLP/gRPC ingestion port (often port 443 with TLS).
Configuring Authentication (Credentials)
Section titled “Configuring Authentication (Credentials)”For security, the trace endpoint is protected by Basic Authentication. You must retrieve your credentials and encode them for use in the Collector configuration.
You find the username and password in the STACKIT Portal:
-
Go to the STACKIT Portal:
https://portal.stackit.cloud -
Navigate to Logging & Monitoring.
-
Select Observability.
-
Choose your specific instance: INSTANCE_ID.
-
Go to the API tab.
-
Click on Credentials.
-
Create an account.
The OTLP Exporter in the Collector requires the credentials to be base64-encoded in the format username:password.
Encoding Format:
BASE64(username:password)
You can perform this encoding using a command-line tool (e.g., echo -n “username:password” | base64).
OpenTelemetry Collector Configuration Example
Section titled “OpenTelemetry Collector Configuration Example”The Collector is the preferred method for managing authentication and exporting data. This example shows a simple configuration (otel-collector-config.yaml) that receives traces via OTLP and forwards them securely to the STACKIT endpoint using the required Basic Auth headers.
collector-config.yaml
receivers:  # Accepts OTLP traces from your applications (e.g., on port 4317)  otlp:    protocols:      grpc:      http:  jaeger:    protocols:      thrift_compact:
processors:  # Batches traces for efficient transmission  batch:
exporters:  debug:    verbosity: detailed    sampling_initial: 5    sampling_thereafter: 200
# Forwards traces to the STACKIT Observability Instance (Tempo)  otlp:    endpoint: "https://TRACING_ENDPOINT_URL_FROM_PORTAL:443" # Replace with the URL from section 3    headers:      # Required for Basic Authentication      authorization: "Basic BASE64_ENCODED_CREDENTIALS" # Replace with the encoded username:password from section 4    tls:      # Use TLS if your endpoint requires it (highly recommended and standard)      insecure: false
service:  pipelines:    traces:      receivers: [otlp, jaeger]      processors: [batch]      exporters: [otlp]
The OTel collector can be run via docker as follows.
docker-compose.yaml
services: otel-collector: image: otel/opentelemetry-collector:latest # image: otel/opentelemetry-collector-contrib container_name: otel-collector command: - --config=/etc/otel-config.yaml volumes: - ./conf/collector-config.yaml:/etc/otel-config.yaml:roBy implementing this Collector configuration, you ensure your traces are reliably collected, batched, authenticated, and securely delivered to your Tempo instance.
Check Traces
Section titled “Check Traces”Now you can select the data source Tempo in Grafana. The recommended way to index the traces is to use the data source Tempo and log the traces in Loki. This assigns the traces to the logs in terms of time.