Create your first Notebooks instance and run a demo Notebook
Last updated on
Prerequisites
Section titled “Prerequisites”- You have a STACKIT customer account: Create a customer Account
- You have a STACKIT user account: Create a user account
- You have a STACKIT project: Create a project
In this guide, you create a Notebooks instance, write your example Notebook and run it.
Creating a Notebooks instance
Section titled “Creating a Notebooks instance”To order a Notebooks instance, navigate to the product in STACKIT Portal and click on Create Notebooks.
You must first enter some general information about the instance. Instance Name must not be longer than 25 characters and must be DNS-compliant (lowercase letters, numbers, hyphen). The chosen instance name will become part of the instance’s URL. Description is an optional field with a maximum of 255 characters.
In this tutorial, we show an implementation with Keycloak. Use our Create and manage instances for Notebooks guide to gather more information on how to configure other Identity Providers.
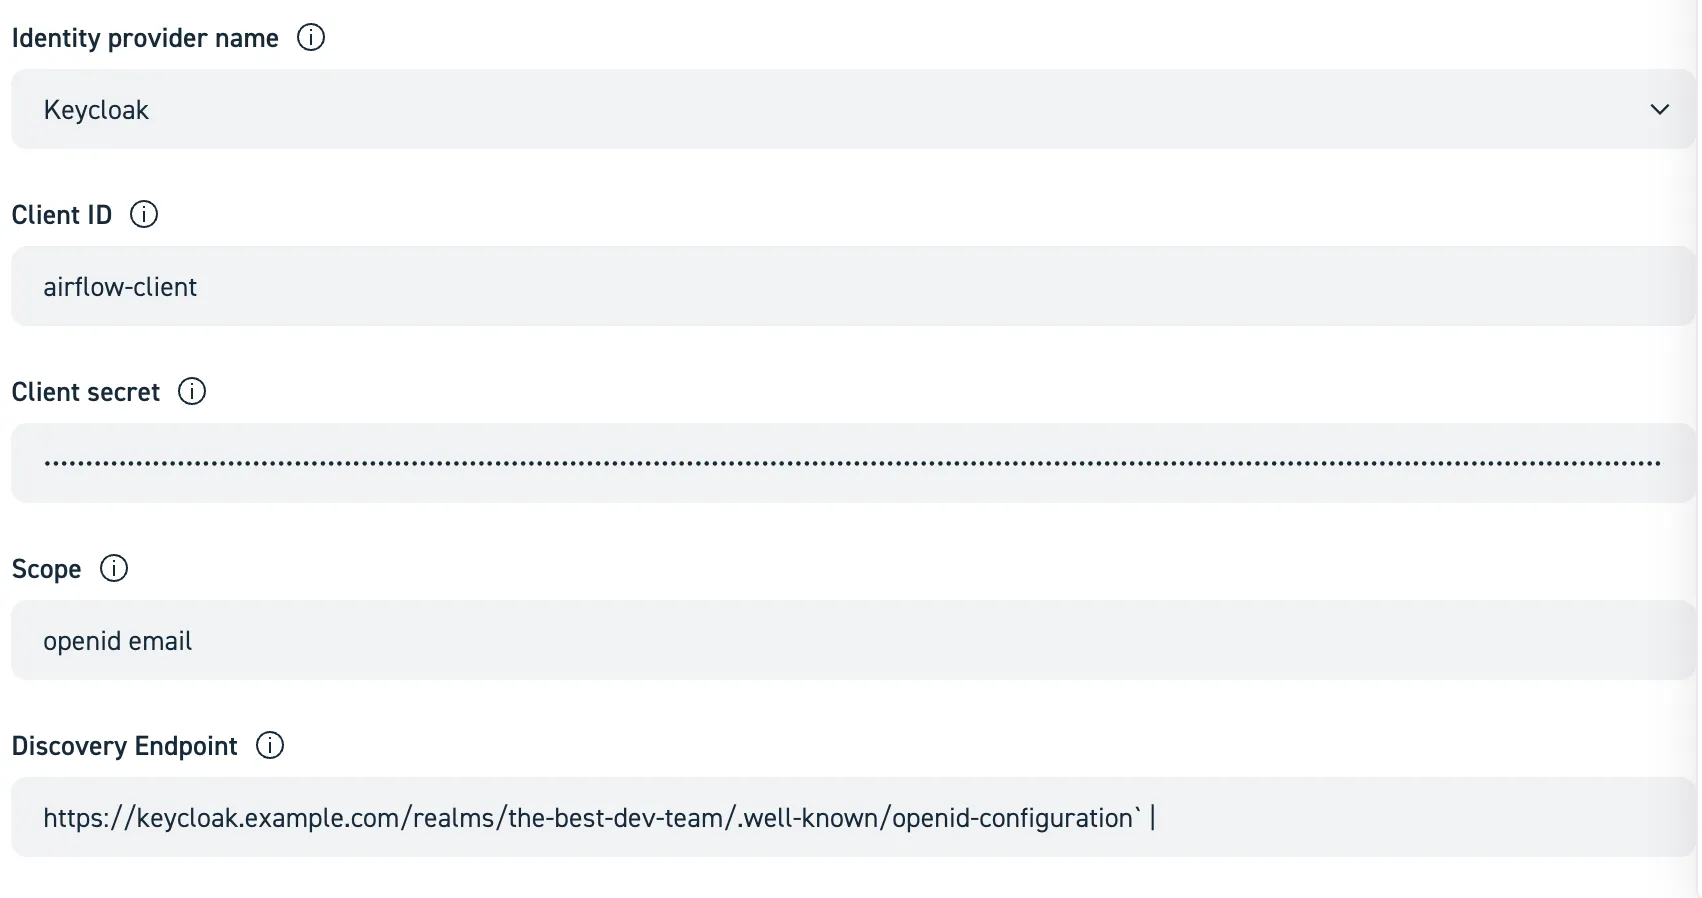
Let’s assume, that you’ve gotten the following credentials from your Keycloak administrator:
Client Id | Client Secret | Scope | Discovery Endpoint |
|---|---|---|---|
jupyterhub-client | YDaXT@s&%7UikF7@q_NLFBVdfUHjX^ | openid email | https://keycloak.example.com/realms/the-best-dev-team/.well-known/openid-configuration |
Then simply enter them in the appropriate fields:
Monitoring To gain insights about the resource consumption, number of (active) users, runtime, etc. of your Notebooks, you can opt-in to export metrics to an already existing STACKIT Observability instance. Hint: an Observability instance with the plan “Observability-Monitoring-Basic-EU01” or higher is recommended. If you do plan to not also use it for log aggregation, use the “Monitoring-only” variant.
Writing and running your first Notebook
Section titled “Writing and running your first Notebook”This guide will walk you through the entire process of creating a simple Notebook, adding it to your Git repository, and running it.
-
Launch your user server
Click on “Go to Notebooks”. You then need to authenticate against the configured Identity Provider. After successful authentication, you are asked about the server you want to launch. You can choose between “Light” (2 vCPU and 8 GiB RAM) and “Medium” (6 vCPU and 24 GiB RAM). Clicking on “Start” launches the server. It will spawn a new Kubernetes Pod with a persistent volume that preserves data between server restarts (including change of server type). The PVC is mounted at /home/jovyan in the Jupyter user pod. This directory is persistent, storing user data like notebooks and files. All other directories in the container (e.g., tmp) are volatile and reset on pod restart.
-
Getting to know the Launcher
Once the server is ready, the JupyterLab “Launcher” shows up. It offers Python3-based Notebooks editing, VS Code editor, and other options. We’ll focus on Notebooks, so choose “Python 3 (ipykernel)”.
-
Edit and save your first Notebook Notebooks are documents combining runnable code with narrative text (markdown, plain-text). The Notebook starts empty with a cursor in a code
cell. Enterprint("Hello World")and either click the “Play” (▶️) button or press Control+Enter. The result of the code run will show up just below.Now click the Save icon or press Control+S. Name the notebook “Getting Started”
-
Install custom Libraries
We recommend using
mambato install custom packages, as we also use it for the base image. Note that installed packages will be gone on restart unless installed with the--userflag. However, we do not recommend using the--userflag as then packages are persisted between restarts which might conflict with updates of the notebooks environment. -
Shut down the server
The server will automatically shut down after one hour of inactivity. However, you can also manually shut down the server when you are done with your work.
Click File > Hub Control Panel and then the red “Stop My Server” button. It will immediately shut down the running server and redirect you to server selection page.
Congratulations! You have successfully authored your first notebook.
Set up Git
Section titled “Set up Git”It is highly recommended to use Git, as mentioned in the Best Practises section.
To enable Git in your JupyterLab environment, click the Git icon in the left navigation bar of JupyterLab. Click “Clone a repository” (assuming you already have one) and enter the URL, and credentials. JupyterLab will then clone the repository into the attached disk.
Once cloning is done, the Git view allows you to commit files, checkout branches, stage changes, push, etc.
Additional insights with STACKIT Observability
Section titled “Additional insights with STACKIT Observability”If you have opted-in for monitoring during STACKIT Notebooks setup, detailed metrics about the health and workload of your Notebooks instance will be pushed to your STACKIT Observability instance. The instance contains a dashboard named STACKIT Notebooks that contains charts showing the status of JupyterHub itself and detailed metrics about notebook-servers, e.g., CPU and memory consumption.