Logs an Observability übertragen
Zuletzt aktualisiert am
Voraussetzungen
Abschnitt betitelt „Voraussetzungen“Anmeldedaten für STACKIT Observability-Instanz generieren
Abschnitt betitelt „Anmeldedaten für STACKIT Observability-Instanz generieren“Um Logs an Ihre STACKIT Observability-Instanz zu übertragen, müssen Sie zunächst Anmeldedaten über die API oder das Portal erstellen. Um Anmeldedaten über das Portal zu generieren, folgen Sie diesen Schritten:
- Gehen Sie zum STACKIT Portal.
- Wählen Sie Ihr Projekt aus.
- Navigieren Sie in der linken Seitenleiste zu Observability.
- Wählen Sie Ihre vorhandene Observability-Instanz aus (oder erstellen Sie eine neue).
- Klicken Sie in der linken Seitenleiste des Instanzmenüs auf API und dann auf Anmeldeinformationen.
- Klicken Sie auf Anmeldeinformationen erstellen.
- Speichern Sie den generierten Benutzernamen und das Passwort sicher ab, da Sie diese für die Agent-Konfiguration benötigen.
Logs generieren
Abschnitt betitelt „Logs generieren“Zuerst müssen Sie Logs von Ihrem Betriebssystem, Dienst oder Ihrer Anwendung erstellen. Es kann jede Log-Bibliothek verwendet werden. Es gibt zwei Möglichkeiten, wie die Logs übergeben werden können:
- In eine Log-Datei geschrieben
- In den Standard-Output (stdout) geschrieben
Logs an STACKIT Observability übertragen
Abschnitt betitelt „Logs an STACKIT Observability übertragen“Sobald die Logs vorhanden sind, müssen sie gesammelt und an Ihre Observability-Instanz gesendet werden. STACKIT Observability unterstützt zwei Protokolle für die Log-Ingestion:
- OpenTelemetry (OTLP) Endpunkt: Der moderne Industriestandard.
- Loki-API-Endpunkt: Das native Grafana Loki-Protokoll.
Unten finden Sie Konfigurationsbeispiele für beide Ansätze.
Option 1: Logs über OpenTelemetry (OTLP) übertragen
Abschnitt betitelt „Option 1: Logs über OpenTelemetry (OTLP) übertragen“STACKIT Observability unterstützt das Ingestieren von OpenTelemetry-Logs über HTTP. Sie können den OpenTelemetry-HTTP-Exporter (otlphttp) konfigurieren, um Log-Daten an Ihre STACKIT Observability-Instanz zu senden. Zusätzlich benötigen wir die basicauth-Erweiterung, um die Authentifizierung per STACKIT-Zugriffstoken zu ermöglichen.
Stellen Sie sicher, dass diese Funktionen in dem von Ihnen verwendeten Agenten enthalten sind. Sie können den offiziellen OpenTelemetry Collector Contrib oder Grafana Alloy verwenden (welches den OpenTelemetry Collector unter der Haube nutzt und OTLP-Komponenten vollständig unterstützt).
Beispiel: Setup mit OpenTelemetry Collector
Abschnitt betitelt „Beispiel: Setup mit OpenTelemetry Collector“Die folgende Konfigurationsdatei zeigt, wie Logs aus einer lokalen Datei gelesen, mit Ressourcen-Attributen angereichert und an den OTLP-Endpunkt übertragen werden. Sie können diese entsprechend Ihren Anforderungen erweitern.
OpenTelemetry Collector-Konfiguration
Abschnitt betitelt „OpenTelemetry Collector-Konfiguration“Ersetzen Sie cluster, instanceId, username und password durch Ihre STACKIT Observability-Zugangsdaten.
extensions:  basicauth/stackit:    client_auth:      username: "[username]"      password: "[password]"
receivers:  filelog:    include:      - /var/log/app/*.log    start_at: end
processors:  batch:    send_batch_size: 1000    timeout: 10s
  resource:    attributes:      - key: service.name        value: custom_service        action: insert      - key: detected.level        value: info        action: insert
exporters:  otlphttp/stackit:    endpoint: "https://logs.stackit[cluster].argus.eu01.stackit.cloud/instances/[instanceId]/otlp"    auth:      authenticator: basicauth/stackit
service:  extensions: [basicauth/stackit]  pipelines:    logs:      receivers: [filelog]      processors: [batch, resource]      exporters: [otlphttp/stackit]
Docker Compose
Abschnitt betitelt „Docker Compose“Verwenden Sie diese docker-compose-Datei, um den OpenTelemetry Collector in einem Docker-Container auszuführen. Sie mountet Ihre lokale Konfiguration und das Log-Verzeichnis in den Container.
services: otel-collector: image: otel/opentelemetry-collector-contrib:latest container_name: otel-collector volumes: - ./config.yaml:/etc/otelcol-contrib/config.yaml:ro - /var/log/app:/var/log/app:ro restart: unless-stoppedOption 2: Logs über Loki-API übertragen
Abschnitt betitelt „Option 2: Logs über Loki-API übertragen“Wenn Sie die Verwendung der nativen Loki-API bevorzugen, können Sie Agenten wie Grafana Alloy oder fluentbit mit Loki-Plugin mit dem Loki-Plugin verwenden. Unten finden Sie Beispielkonfigurationen dieser Tools.
Beispiel: Setup mit Grafana Alloy
Abschnitt betitelt „Beispiel: Setup mit Grafana Alloy“In diesem Beispiel sammeln wir Logs aus verschiedenen Quellen, z. B. von einer virtuellen Maschine.
Grafana Alloy sammelt alle Logs und sendet sie an eine Observability-Loki-Instanz.
Grafana Alloy-Konfiguration
Abschnitt betitelt „Grafana Alloy-Konfiguration“Ersetzen Sie cluster, instanceId, username und password durch Ihre STACKIT Observability-Zugangsdaten.
local.file_match "node_logs" {  path_targets = [{      // Monitor syslog to scrape node-logs      __path__  = "/var/log/syslog",      job       = "node/syslog",      node_name = sys.env("HOSTNAME"),      cluster   = "[cluster]",  }]}
// loki.source.file reads log entries from files and forwards them to other loki.* components.// You can specify multiple loki.source.file components by giving them different labels.loki.source.file "node_logs" {  targets    = local.file_match.node_logs.targets  forward_to = [loki.write.loki_instance.receiver]}
logging {  level    = "info"  format   = "json"  write_to = [loki.write.loki_instance.receiver]}
loki.write "loki_instance" {  endpoint {    url = "https://logs.stackit[cluster].argus.eu01.stackit.cloud/instances/[instanceId]/loki/api/v1/push"    basic_auth {      username = "[username]"      password = "[password]"    }    retry_on_http_429 = true  }}
Docker Compose
Abschnitt betitelt „Docker Compose“Verwenden Sie diese docker-compose-Datei, um Grafana Alloy in einem Docker-Container auszuführen. Die Alloy-UI und -API sind über Port 12345 erreichbar.
services: alloy: image: grafana/alloy:latest container_name: alloy command: - run - --server.http.listen-addr=0.0.0.0:12345 - --storage.path=/var/lib/alloy/data - /etc/alloy/config.alloy ports: - "12345:12345" volumes: - ./config.alloy:/etc/alloy/config.alloy:ro - /var/run/docker.sock:/var/run/docker.sock:ro - alloy-data:/var/lib/alloy/data restart: unless-stoppedvolumes: alloy-data:Beispiel: Setup mit fluentbit
Abschnitt betitelt „Beispiel: Setup mit fluentbit“Im zweiten Beispiel wollen wir Container-Logs scrapen und verwenden dafür fluentbit.
fluentbit-Konfiguration
Abschnitt betitelt „fluentbit-Konfiguration“Ersetzen Sie cluster, instanceId, username und password durch Ihre STACKIT Observability-Zugangsdaten.
[Output] Name loki Match * Tls on Host logs.stackit[cluster].argus.eu01.stackit.cloud Uri /instances/[instanceId]/loki/api/v1/push Port 443 Labels job=fluent-bit,env=${FLUENT_ENV} Http_User [username] Http_Passwd [password] Line_format json
[SERVICE] Parsers_File /fluent-bit/etc/parsers.conf # fluentbit needs a parser. This should point to the parser Flush 5 Daemon Off Log_Level debug
[FILTER] Name parser Match * Parser docker Key_name log
[INPUT] Name forward Listen 0.0.0.0 Port 24224
Parser-Konfiguration
Abschnitt betitelt „Parser-Konfiguration“[PARSER] Name docker Format json Time_Key time Time_Format %Y-%m-%dT%H:%M:%S.%L Time_Keep On Decode_Field_As json log log Decode_Field_As json level Decode_Field_As json ts Decode_Field_As json caller Decode_Field_As json msg msgDocker Compose
Abschnitt betitelt „Docker Compose“services: fluentbit: image: grafana/fluent-bit-plugin-loki:latest container_name: fluentbit_python_local volumes: - ./logging:/fluent-bit/etc # logging directory contains parsers.conf and fluent-bit.conf ports: - "24224:24224" - "24224:24224/udp"
app: build: context: ./app dockerfile: ./docker/local/Dockerfile image: app container_name: app privileged: true volumes: - ./:/app ports: - "3000:3000" command: sh -c 'air' logging: driver: fluentd # to make fluentbit work with docker this driver is neededBeispiel: Setup mit Kubernetes und fluentbit
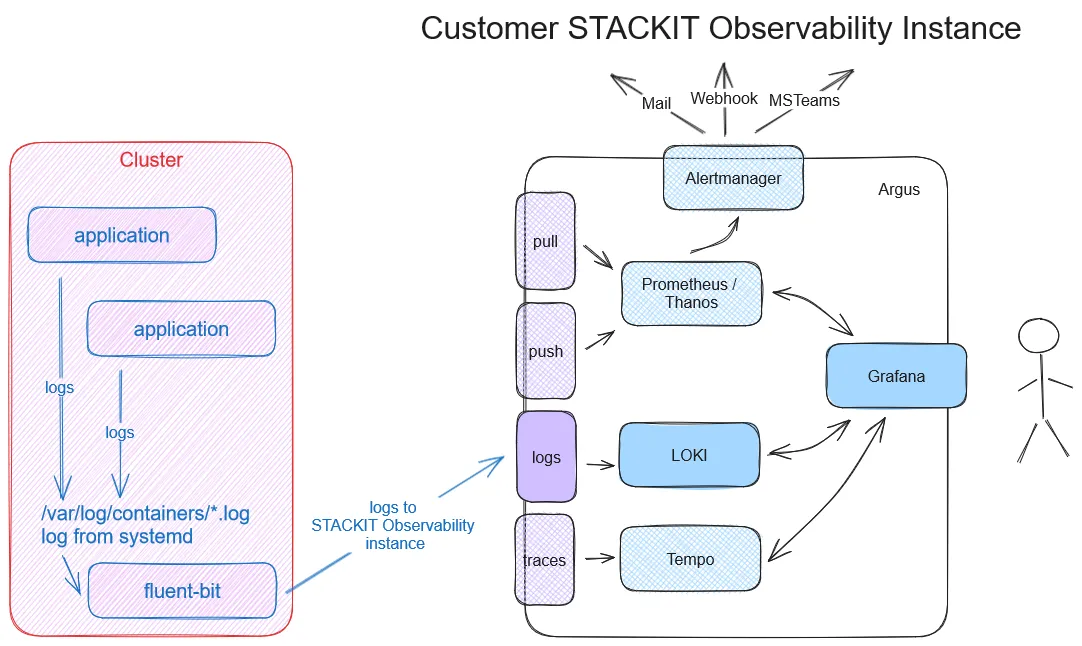
Abschnitt betitelt „Beispiel: Setup mit Kubernetes und fluentbit“Um Logs von einer oder mehreren Anwendungen an Loki zu senden, müssen Sie fluentbit in Ihrem Cluster installieren. Dies leitet den Output direkt an Ihre STACKIT Observability-Instanz weiter.
Sie können Logs auch an mehrere STACKIT Observability-Instanzen senden. Beachten Sie, dass die URL im fluentbit-Output-Plugin Ihre spezifische Instanz-ID enthalten muss.
Applizieren Sie die folgenden Dateien in Ihrem Kubernetes-Cluster:
kind: NamespaceapiVersion: v1metadata: name: kube-loggingapiVersion: v1kind: ServiceAccountmetadata: name: fluent-bit namespace: kube-loggingapiVersion: rbac.authorization.k8s.io/v1kind: ClusterRolemetadata: name: fluent-bit-readrules:- apiGroups: [""] resources: - namespaces - pods verbs: ["get", "list", "watch"]apiVersion: rbac.authorization.k8s.io/v1kind: ClusterRoleBindingmetadata: name: fluent-bit-readroleRef: apiGroup: rbac.authorization.k8s.io kind: ClusterRole name: fluent-bit-readsubjects:- kind: ServiceAccount name: fluent-bit namespace: kube-loggingErsetzen Sie username und password durch Ihre STACKIT Observability-Zugangsdaten.
apiVersion: v1kind: Secretmetadata: name: fluent-bit-secrets namespace: kube-loggingtype: OpaquestringData: username: "[username]" password: "[password]"Ersetzen Sie cluster und instanceId durch Ihre STACKIT Observability-Zugangsdaten.
apiVersion: v1kind: ConfigMapmetadata:  name: fluent-bit-config  namespace: kube-logging  labels:    k8s-app: fluent-bitdata:  fluent-bit.conf: |    [SERVICE]        Daemon          Off        Flush           1        Log_Level       info        Parsers_File    /fluent-bit/etc/parsers.conf        Parsers_File    /fluent-bit/etc/conf/custom_parsers.conf        HTTP_Server     On        HTTP_Listen     0.0.0.0        HTTP_Port       2020        Health_Check    On
    [INPUT]        Name            tail        Path            /var/log/containers/*.log        Parser          cri        Tag             kube.*        Mem_Buf_Limit   5MB        Skip_Long_Lines On
    [INPUT]        Name            systemd        Tag             host.*        Systemd_Filter  _SYSTEMD_UNIT=kubelet.service        Read_From_Tail  On
    [FILTER]        Name                kubernetes        Match               kube.*        Merge_Log           On        Keep_Log            Off        K8S-Logging.Parser  On        K8S-Logging.Exclude On
    [OUTPUT]        name            loki        match           *        host            logs.stackit[cluster].argus.eu01.stackit.cloud        uri             /instances/[instanceId]/loki/api/v1/push        port            443        http_user       ${FLUENT_USER}        http_passwd      ${FLUENT_PASS}        tls             on        tls.verify      on        line_format     json        labels          job=fluent-bit        label_map_path  /fluent-bit/etc/conf/labelmap.json
  parsers.conf: |    [PARSER]        Name         cri        Format       regex        Regex        ^(?<time>[^ ]+) (?<stream>stdout|stderr) (?<logtag>[^ ]*) (?<message>.*)$        Time_Key    time        Time_Format %Y-%m-%dT%H:%M:%S.%L%z
  custom_parsers.conf: |    [PARSER]        Name            docker        Format          json        Time_Key        time        Time_Format     %Y-%m-%dT%H:%M:%S.%L        Time_Keep       On        Decode_Field_As json log log        Decode_Field_As json level        Decode_Field_As json ts        Decode_Field_As json caller        Decode_Field_As json msg msg
labelmap.json: |- { "kubernetes": { "container_name": "container", "host": "node", "labels": { "app": "app", "release": "release" }, "namespace_name": "namespace", "pod_name": "instance" }, "stream": "stream" }apiVersion: apps/v1kind: DaemonSetmetadata: name: fluent-bit namespace: kube-logging labels: app.kubernetes.io/name: fluent-bit app.kubernetes.io/instance: fluent-bit-lokispec: selector: matchLabels: k8s-app: fluent-bit-logging template: metadata: labels: k8s-app: fluent-bit-logging spec: serviceAccountName: fluent-bit terminationGracePeriodSeconds: 10 containers: - name: fluent-bit image: "fluent/fluent-bit:latest" imagePullPolicy: Always command: - /fluent-bit/bin/fluent-bit args: - --workdir=/fluent-bit/etc - --config=/fluent-bit/etc/conf/fluent-bit.conf ports: - name: http containerPort: 2020 protocol: TCP livenessProbe: httpGet: path: / port: http readinessProbe: httpGet: path: /api/v1/health port: http volumeMounts: - name: varlog mountPath: /var/log - name: varlibdockercontainers mountPath: /var/lib/docker/containers readOnly: true - name: journal mountPath: /journal readOnly: true - name: fluent-bit-config mountPath: /fluent-bit/etc/conf env: - name: FLUENT_USER valueFrom: secretKeyRef: name: fluent-bit-secrets key: username - name: FLUENT_PASS valueFrom: secretKeyRef: name: fluent-bit-secrets key: password volumes: - name: varlog hostPath: path: /var/log - name: journal hostPath: path: /var/log/journal - name: varlibdockercontainers hostPath: path: /var/lib/docker/containers - name: fluent-bit-config configMap: name: fluent-bit-config tolerations: - key: node-role.kubernetes.io/master effect: NoScheduleErstellen Sie eine kleine Testanwendung, um einige Beispiel-Logs zu erzeugen. Für dieses Beispiel werden wir einen NGINX-Webserver bereitstellen:
apiVersion: v1kind: PersistentVolumeClaimmetadata: name: my-pvcspec: accessModes: - ReadWriteOnce resources: requests: storage: 1Gi # Fordert 1 Gigabyte Speicher anapiVersion: apps/v1kind: Deploymentmetadata: name: nginx-deploymentspec: replicas: 3 selector: matchLabels: app: nginx template: metadata: labels: app: nginx spec: containers: - name: nginx image: nginx:latest ports: - containerPort: 80 volumeMounts: - name: data mountPath: /usr/share/nginx/html resources: limits: memory: "256Mi" cpu: "200m" requests: memory: "128Mi" cpu: "100m" livenessProbe: httpGet: path: / port: 80 initialDelaySeconds: 15 periodSeconds: 10 readinessProbe: httpGet: path: / port: 80 initialDelaySeconds: 5 periodSeconds: 5 volumes: - name: data persistentVolumeClaim: claimName: my-pvcÜberprüfen Sie als Nächstes, ob Ihre bereitgestellten Pods erfolgreich laufen:
$ kubectl get namespacesNAME STATUS AGEdefault Active 6dkube-logging Active 4d3hkube-node-lease Active 6dkube-public Active 6dkube-system Active 6d
$ kubectl get pods -n kube-loggingNAME READY STATUS RESTARTS AGEfluent-bit-c9b8d 1/1 Running 0 23h
$ kubectl get pods -n defaultNAME READY STATUS RESTARTS AGEnginx-deployment-58fc999d7b-56jrq 1/1 Running 0 9m2snginx-deployment-58fc999d7b-5gkwz 1/1 Running 0 9m2snginx-deployment-58fc999d7b-gxbfr 1/1 Running 0 9m2s
Sobald alles läuft, öffnen Sie Grafana und verwenden Sie die Loki-Datenquelle, um zu bestätigen, dass Ihre Logs ankommen:

Referenzen
Abschnitt betitelt „Referenzen“- fluentbit und Kubernetes
- fluentbit Loki Output
- fluentbit Helm-Charts (benutzen Sie fluent-bit-0.43.0 oder höher)
- fluentbit Docker-Image (benutzen Sie 2.2.2 oder höher)