Connect MongoDB Flex with STACKIT Observability
Last updated on
To get a visual representation of your metrics and have your metrics saved, you can use STACKIT Observability service. With the following steps you can learn how to integrate MongoDB into your Observability service instance.
Requirements
Section titled “Requirements”- You have created a MongoDB Flex instance.
Check Create and manage instances of MongoDB Flex. - You have a STACKIT Observability managed service configured and running. Check Create and configure your first Observability service.
- You have a running instance of Grafana Alloy. This guide assumes, that you use a container. This is, why we reference it in the text. You can also use a Virtual Machine or run it in another environment.
Preparation
Section titled “Preparation”Before configuring Grafana Alloy environment, you need to prepare the needed service account. This guide uses the Portal for achieving this task. You can also use the STACKIT CLI.
Create a Service Account and grant access to the API
Section titled “Create a Service Account and grant access to the API”-
Navigate to IAM and management > Service accounts.
-
Click + Create service account.
-
Give the new service account a name and click on Create. The account has been created.
-
Go into the account by clicking its name.
-
Navigate to Service account keys.
-
Click + Create service account key.
-
Select Create new key pair and click on Create.
-
Download the newly created credentials. At least you need the JSON file that contains all relevant information.
-
Navigate to IAM and management* Access.
-
Click + Grant Access.
-
Add the mail address (ID) of the newly created service account.
-
Select the role MongoDB Flex Reader and click Save.
Create Observability API Credentials
Section titled “Create Observability API Credentials”-
Navigate to Logging & Monitoring > Observability.
-
Select your Observability instance.
-
Navigate to API > Credentials.
-
Click + Create credentials and then click Create.
Prepare the helper scripts and configure Grafana Alloy
Section titled “Prepare the helper scripts and configure Grafana Alloy”-
Copy the JSON file, you downloaded in the Preparation, to your virtual machine.
In this guide we copy it to
/usr/local/etc/stackit/sa/service-account.json. If you choose another location, you need to adapt the commands in the following steps. -
Create a cronjob for updating the Bearer Token.
Manually try to acquire a token with the STACKIT CLI.
Terminal window stackit auth activate-service-account --service-account-key-path /usr/local/etc/stackit/sa/service-account.json --only-print-access-tokenThe maximum token lifetime is 60 minutes, so the token needs to be renewed beforehand. To automate this step, you can place this command in crontab and write the token in a new file. This file should also be protected.
*/5 * * * * /usr/bin/stackit auth activate-service-account --service-account-key-path /usr/local/etc/stackit/sa/service-account.json --only-print-access-token > /run/secrets/bearer_token 2>/dev/null -
Configure Grafana Alloy Now configure Grafana Alloy to your needs. Use the following code snippet for scraping the MongoDB Flex metrics and forward them to STACKIT Observability. Replace
projectID,region,mongoDBFlexInstanceID,jobName,ObservabilityInstanceIDandobservabilityAPIUsernamewith the according values.prometheus.scrape "mongodb" {targets = [{__address__ = "mongodb-prom-proxy.api.stackit.cloud:443",__metrics_path__ = "/v2/projects/[projectID]/regions/[region]/instances/[mongoDBFlexInstanceID]/metrics",},]forward_to = [prometheus.remote_write.observability.receiver,]job_name = "[jobName]"scheme = "https"scrape_interval = "5m"authorization {type = "Bearer"credentials_file = "/run/secrets/bearer_token"}}prometheus.remote_write "observability" {endpoint {url = "https://push.metrics.stackit5.argus.eu01.stackit.cloud/instances/`ObservabilityInstanceID`/api/v1/receive"basic_auth {username = "[observabilityAPIUsername]"password_file = "/run/secrets/observability_write_password"}}} -
Restart the container or service
-
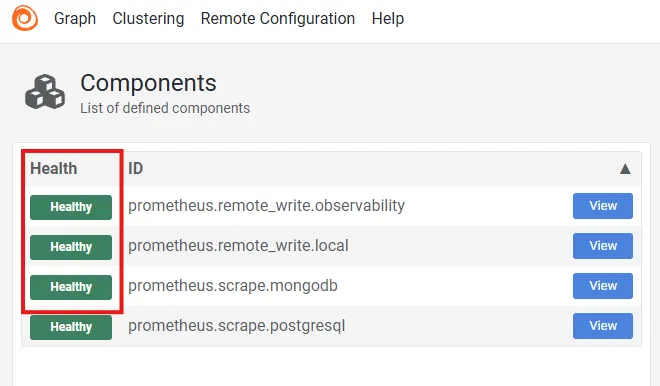
Test Grafana Alloy
Open your Grafana Alloy instance with a browser. The dashboard shows the defined components with their health state. The Health column should show “healthy” for your configurations, according to the screenshot below.
Check the result with STACKIT Observability
Section titled “Check the result with STACKIT Observability”-
Navigate to Logging & Monitoring > Observability.
-
Select your observability instance.
-
Navigate to Grafana and follow the link to Grafana Dashboard.
-
Login with your credentials (or SSO).
-
In Grafana navigate to Explore > Metrics.
-
Click on + New metric exploration.
In the metrics exploration page, search for
mongodb_. You should see now the MongoDB Flex metrics: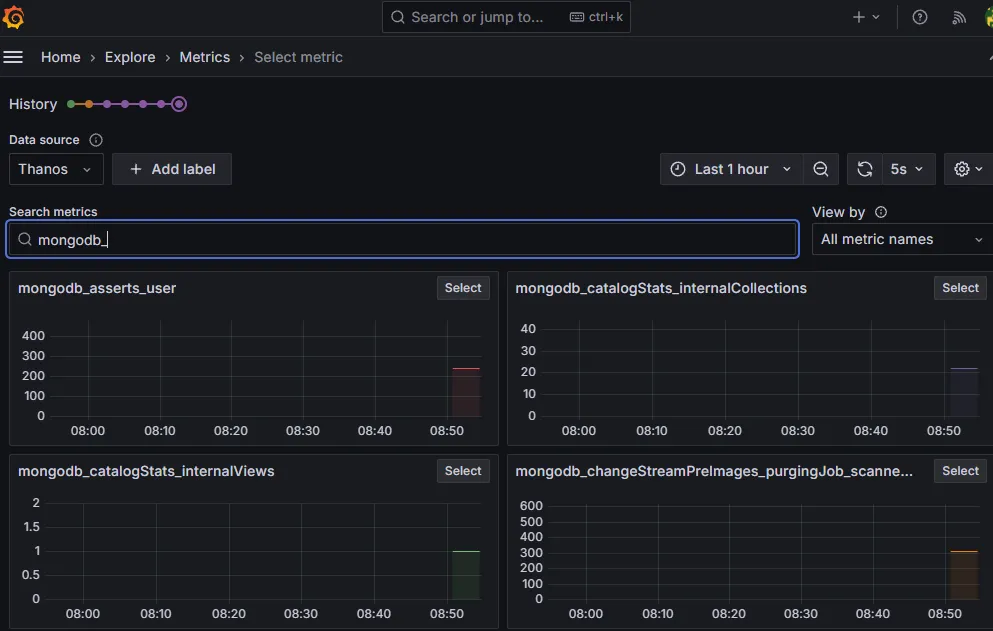
Enhance the experience with Grafana by importing our template
Section titled “Enhance the experience with Grafana by importing our template”We offer a Grafana template that suits to STACKIT MongoDB Flex. Visit the Observability metrics of MongoDB Flex reference article, to download the file.