Scrape MongoDB Flex Observability data with Prometheus
Last updated on
With the following steps you can learn how to scrape your MongoDB Flex Observability data with Prometheus.
Requirements
Section titled “Requirements”- You have created a MongoDB Flex instance.
Check Create and manage instances of MongoDB Flex. - You have a running instance of Prometheus. This guide assumes, that you use a container. This is, why we reference it in the text. You can also use a Virtual Machine or run it in another environment.
Preparation
Section titled “Preparation”Before configuring your Prometheus environment, you need to prepare the needed service account. This guide uses the Portal for achieving this task. You can also use the STACKIT CLI.
Create a Service Account and grant access to the API
Section titled “Create a Service Account and grant access to the API”-
Navigate to IAM and management > Service accounts.
-
Click + Create service account.
-
Give the new service account a name and click on Create. The account has been created.
-
Go into the account by clicking its name.
-
Navigate to Service account keys.
-
Click + Create service account key.
-
Select Create new key pair and click on Create.
-
Download the newly created credentials. At least you need the JSON file that contains all relevant information.
-
Navigate to IAM and management* Access.
-
Click + Grant Access.
-
Add the mail address (ID) of the newly created service account.
-
Select the role MongoDB Flex Reader and click Save.
Configure Prometheus
Section titled “Configure Prometheus”-
Copy the JSON file, you downloaded in the Preparation, to your virtual machine.
In this guide we copy it to
/usr/local/etc/stackit/sa/service-account.json. If you choose another location, you need to adapt the commands in the following steps. -
Create a cronjob for updating the Bearer Token.
Manually try to acquire a token with the STACKIT CLI.
Terminal window stackit auth activate-service-account --service-account-key-path /usr/local/etc/stackit/sa/service-account.json --only-print-access-tokenThe maximum token lifetime is 60 minutes, so the token needs to be renewed beforehand. To automate this step, you can place this command in crontab and write the token in a new file. This file should also be protected.
*/5 * * * * /usr/bin/stackit auth activate-service-account --service-account-key-path /usr/local/etc/stackit/sa/service-account.json --only-print-access-token > /run/secrets/bearer_token 2>/dev/null -
Configure Prometheus Now configure Prometheus to your needs. Use the following code snippet for scraping the MongoDB Flex metrics. Replace
projectID,regionandMongoDBFlexInstanceIDwith the according values.scrape_configs:- job_name: "<job name>"metrics_path: "/v2/projects/[projectID]/regions/[region]/instances/[MongoDBFlexInstanceID]/metrics"scheme: "https"bearer_token_file: /run/secrets/bearer_tokenstatic_configs:- targets: ['mongodb-prom-proxy.api.stackit.cloud:443'] -
Restart the container or service
-
Test Prometheus
Open your Prometheus instance with a browser. Navigate to Status > Monitoring status: “Target health”. The State of the defined scraper should be
UP: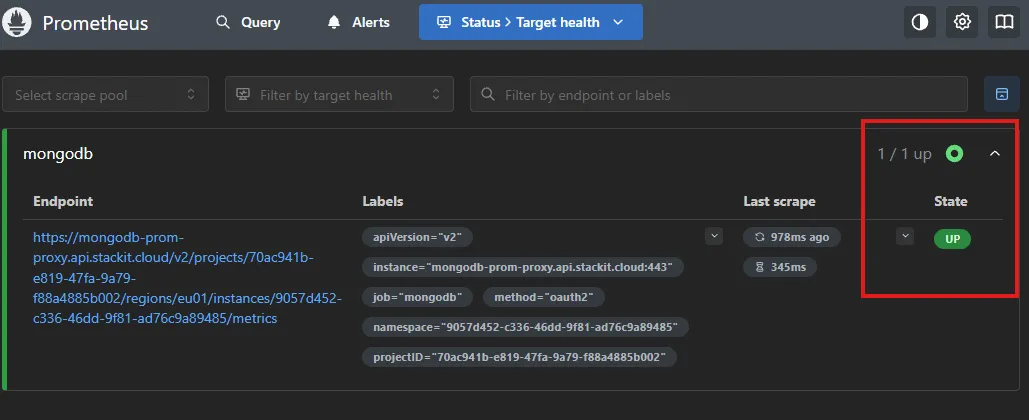
-
Configure Prometheus
Configure Prometheus to your needs. Use the following code snippet for scraping the MongoDB Flex metrics. Prometheus >= 3.8 has native support for service account keys.
Replace
projectID,region,MongoDBFlexInstanceID,serviceAccountID,serviceAccountKeyID,serviceAccountKeyPrivateKeyandServiceAccountMailAddresswith the according values.scrape_configs:- job_name: "<job name>"metrics_path: "/v2/projects/[projectID]/regions/[region]/instances/[MongoDBFlexInstanceID]/metrics"scheme: "https"oauth2:client_id: [serviceAccountID]client_certificate_key_file: [serviceAccountKeyPrivateKey]grant_type: urn:ietf:params:oauth:grant-type:jwt-bearertoken_url: https://service-account.api.stackit.cloud/tokenclient_certificate_key_id: [serviceAccountKeyID]iss: [ServiceAccountMailAddress]audience: https://stackit-service-account-prod.apps.01.cf.eu01.stackit.cloudsignature_algorithm: RS512static_configs:- targets: ['mongodb-prom-proxy.api.stackit.cloud:443'] -
Restart the container or service
-
Test Prometheus
Open your Prometheus instance with a browser. Navigate to Status > Monitoring status: “Target health”. The State of the defined scraper should be
UP:
- If you use Grafana to visualize your metrics, use our MongoDB Flex Grafana template. Visit the Observability metrics of MongoDB Flex reference article, to download the file.