How to push logs
Last updated on
Prerequisites
Section titled “Prerequisites”Before you can push logs to your STACKIT Observability instance, ensure you have the following ready:
- Technical Credentials: You need a technical
<USERNAME>and<PASSWORD>for your specific instance. If you haven’t generated these yet, follow the instructions in our Authentication Overview. - Log Source: You must have logs generated from your operating system, service, or application. Any log library can be used. These logs can either be written to a local log file or written to standard out.
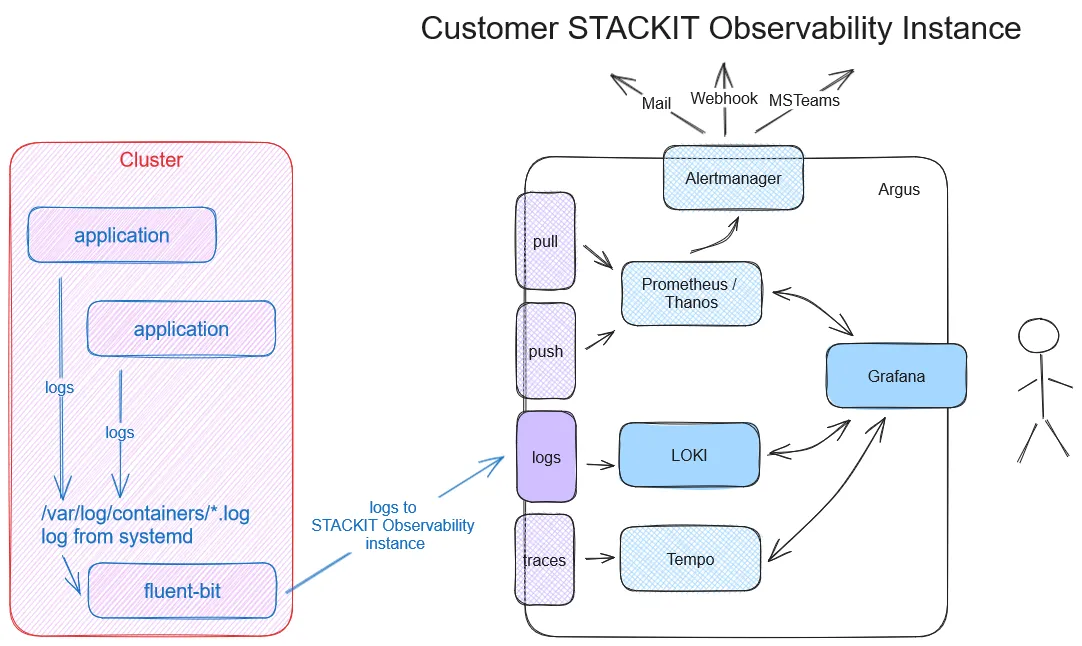
Pushing Logs to STACKIT Observability
Section titled “Pushing Logs to STACKIT Observability”Once the logs exist, they have to be collected and sent to your Observability instance. STACKIT Observability supports two main protocols for log ingestion:
- OpenTelemetry (OTLP) Endpoint: The modern industry standard.
- Loki API Endpoint: The native Grafana Loki protocol.
Below you will find configuration examples for both approaches.
Option 1: Push logs via OpenTelemetry (OTLP)
Section titled “Option 1: Push logs via OpenTelemetry (OTLP)”STACKIT Observability supports ingesting OpenTelemetry logs over HTTP. You can configure the OpenTelemetry HTTP exporter (otlphttp) to send log data to your STACKIT Observability instance. Additionally, the basicauth extension is required to enable STACKIT access token authentication.
Ensure these features come bundled in the agent you are using. You can use the official OpenTelemetry Collector Contrib or Grafana Alloy (which uses the OpenTelemetry Collector under the hood and fully supports OTLP components).
Example: Setup using OpenTelemetry Collector
Section titled “Example: Setup using OpenTelemetry Collector”The following configuration file shows how to read logs from a local file, enrich them with resource attributes, and push them to the OTLP endpoint. You can extend it according to your requirements.
OpenTelemetry Collector configuration
Section titled “OpenTelemetry Collector configuration”extensions: basicauth/stackit: client_auth: username: "<USERNAME>" password: "<PASSWORD>"
receivers: filelog: include: - /var/log/app/*.log start_at: end
processors: batch: send_batch_size: 1000 timeout: 10s
resource: attributes: - key: service.name value: custom_service action: insert - key: detected.level value: info action: insert
exporters: otlphttp/stackit: # IMPORTANT: Copy the "OTLP ingest" URL from the STACKIT Portal, # but you MUST remove the '/v1/logs' suffix at the end! # Example: https://logs.stackit9.argus.eu01.stackit.cloud/instances/.../otlp endpoint: "<OTLP_INGEST_URL_WITHOUT_V1_LOGS_SUFFIX>" auth: authenticator: basicauth/stackit
service: extensions: [basicauth/stackit] pipelines: logs: receivers: [filelog] processors: [batch, resource] exporters: [otlphttp/stackit]Docker Compose
Section titled “Docker Compose”Use this docker-compose file to run the OpenTelemetry Collector in a docker container. It mounts your local config and the log directory into the container.
services: otel-collector: image: otel/opentelemetry-collector-contrib:latest container_name: otel-collector volumes: - ./config.yaml:/etc/otelcol-contrib/config.yaml:ro - /var/log/app:/var/log/app:ro restart: unless-stoppedOption 2: Push logs via Loki API
Section titled “Option 2: Push logs via Loki API”If you prefer using the native Loki API, you can use agents like Grafana Alloy or fluentbit with the Loki plugin. Below you can find example configurations of those tools.
Example: Setup using Grafana Alloy
Section titled “Example: Setup using Grafana Alloy”In this example we collect logs from different sources e.g. of a virtual machine. Grafana Alloy collects all logs and sends them to an Observability Loki instance.
Grafana Alloy configuration
Section titled “Grafana Alloy configuration”local.file_match "node_logs" { path_targets = [{ // Monitor syslog to scrape node-logs __path__ = "/var/log/syslog", job = "node/syslog", node_name = sys.env("HOSTNAME"), cluster = "[cluster]", }]}
// loki.source.file reads log entries from files and forwards them to other loki.* components.// You can specify multiple loki.source.file components by giving them different labels.loki.source.file "node_logs" { targets = local.file_match.node_logs.targets forward_to = [loki.write.loki_instance.receiver]}
logging { level = "info" format = "json" write_to = [loki.write.loki_instance.receiver]}
loki.write "loki_instance" { endpoint { # Copy the full "Ingest" URL from the STACKIT Portal url = "<LOKI_INGEST_URL_FROM_PORTAL>" basic_auth { username = "<USERNAME>" password = "<PASSWORD>" } retry_on_http_429 = true }}Docker Compose
Section titled “Docker Compose”Use this docker-compose file to run Grafana Alloy in a docker container. The Alloy UI and API is accessible over port 12345.
services: alloy: image: grafana/alloy:latest container_name: alloy command: - run - --server.http.listen-addr=0.0.0.0:12345 - --storage.path=/var/lib/alloy/data - /etc/alloy/config.alloy ports: - "12345:12345" volumes: - ./config.alloy:/etc/alloy/config.alloy:ro - /var/run/docker.sock:/var/run/docker.sock:ro - alloy-data:/var/lib/alloy/data restart: unless-stoppedvolumes: alloy-data:Example: Setup using fluentbit
Section titled “Example: Setup using fluentbit”In the second example we want to scrape container logs and use fluentbit for that.
fluentbit configuration
Section titled “fluentbit configuration”[Output] Name loki Match * Tls on
# Extract the domain from your STACKIT Portal "Ingest" URL # Example: logs.stackit9.argus.eu01.stackit.cloud Host <LOKI_HOST_FROM_PORTAL_URL>
# Extract the path from your STACKIT Portal "Ingest" URL # Example: /instances/.../loki/api/v1/push Uri <LOKI_URI_FROM_PORTAL_URL>
Port 443 Labels job=fluent-bit,env=${FLUENT_ENV} Http_User <USERNAME> Http_Passwd <PASSWORD> Line_format json
[SERVICE] Parsers_File /fluent-bit/etc/parsers.conf # fluentbit needs a parser. This should point to the parser Flush 5 Daemon Off Log_Level debug
[FILTER] Name parser Match * Parser docker Key_name log
[INPUT] Name forward Listen 0.0.0.0 Port 24224Parsers Configuration
Section titled “Parsers Configuration”[PARSER] Name docker Format json Time_Key time Time_Format %Y-%m-%dT%H:%M:%S.%L Time_Keep On Decode_Field_As json log log Decode_Field_As json level Decode_Field_As json ts Decode_Field_As json caller Decode_Field_As json msg msgDocker Compose
Section titled “Docker Compose”services: fluentbit: image: grafana/fluent-bit-plugin-loki:latest container_name: fluentbit_python_local volumes: - ./logging:/fluent-bit/etc # logging directory contains parsers.conf and fluent-bit.conf ports: - "24224:24224" - "24224:24224/udp"
app: build: context: ./app dockerfile: ./docker/local/Dockerfile image: app container_name: app privileged: true volumes: - ./:/app ports: - "3000:3000" command: sh -c 'air' logging: driver: fluentd # to make fluentbit work with docker this driver is neededExample: Setup using Kubernetes and fluentbit
Section titled “Example: Setup using Kubernetes and fluentbit”To send logs from one or more applications to Loki, you must install fluentbit in your cluster. This routes the output directly to your STACKIT Observability instance.
You can also send logs to multiple STACKIT Observability instances. Note that the URL in the fluentbit output plugin must contain your specific instance ID.
Deploy the following files in your Kubernetes cluster:
kind: NamespaceapiVersion: v1metadata: name: kube-loggingapiVersion: v1kind: ServiceAccountmetadata: name: fluent-bit namespace: kube-loggingapiVersion: rbac.authorization.k8s.io/v1kind: ClusterRolemetadata: name: fluent-bit-readrules: - apiGroups: [""] resources: - namespaces - pods verbs: ["get", "list", "watch"]apiVersion: rbac.authorization.k8s.io/v1kind: ClusterRoleBindingmetadata: name: fluent-bit-readroleRef: apiGroup: rbac.authorization.k8s.io kind: ClusterRole name: fluent-bit-readsubjects: - kind: ServiceAccount name: fluent-bit namespace: kube-loggingapiVersion: v1kind: Secretmetadata: name: fluent-bit-secrets namespace: kube-loggingtype: OpaquestringData: username: "<USERNAME>" password: "<PASSWORD>"apiVersion: v1kind: ConfigMapmetadata: name: fluent-bit-config namespace: kube-logging labels: k8s-app: fluent-bitdata: fluent-bit.conf: | [SERVICE] Daemon Off Flush 1 Log_Level info Parsers_File /fluent-bit/etc/parsers.conf Parsers_File /fluent-bit/etc/conf/custom_parsers.conf HTTP_Server On HTTP_Listen 0.0.0.0 HTTP_Port 2020 Health_Check On
[INPUT] Name tail Path /var/log/containers/*.log Parser cri Tag kube.* Mem_Buf_Limit 5MB Skip_Long_Lines On
[INPUT] Name systemd Tag host.* Systemd_Filter _SYSTEMD_UNIT=kubelet.service Read_From_Tail On
[FILTER] Name kubernetes Match kube.* Merge_Log On Keep_Log Off K8S-Logging.Parser On K8S-Logging.Exclude On
[OUTPUT] name loki match *
# Extract the domain from your STACKIT Portal "Ingest" URL # Example: logs.stackit9.argus.eu01.stackit.cloud host <LOKI_HOST_FROM_PORTAL_URL>
# Extract the path from your STACKIT Portal "Ingest" URL # Example: /instances/.../loki/api/v1/push uri <LOKI_URI_FROM_PORTAL_URL>
port 443 http_user ${FLUENT_USER} http_passwd ${FLUENT_PASS} tls on tls.verify on line_format json labels job=fluent-bit label_map_path /fluent-bit/etc/conf/labelmap.json
parsers.conf: | [PARSER] Name cri Format regex Regex ^(?<time>[^ ]+) (?<stream>stdout|stderr) (?<logtag>[^ ]*) (?<message>.*)$ Time_Key time Time_Format %Y-%m-%dT%H:%M:%S.%L%z
custom_parsers.conf: | [PARSER] Name docker Format json Time_Key time Time_Format %Y-%m-%dT%H:%M:%S.%L Time_Keep On Decode_Field_As json log log Decode_Field_As json level Decode_Field_As json ts Decode_Field_As json caller Decode_Field_As json msg msg
labelmap.json: |- { "kubernetes": { "container_name": "container", "host": "node", "labels": { "app": "app", "release": "release" }, "namespace_name": "namespace", "pod_name": "instance" }, "stream": "stream" }apiVersion: apps/v1kind: DaemonSetmetadata: name: fluent-bit namespace: kube-logging labels: app.kubernetes.io/name: fluent-bit app.kubernetes.io/instance: fluent-bit-lokispec: selector: matchLabels: k8s-app: fluent-bit-logging template: metadata: labels: k8s-app: fluent-bit-logging spec: serviceAccountName: fluent-bit terminationGracePeriodSeconds: 10 containers: - name: fluent-bit image: "fluent/fluent-bit:latest" imagePullPolicy: Always command: - /fluent-bit/bin/fluent-bit args: - --workdir=/fluent-bit/etc - --config=/fluent-bit/etc/conf/fluent-bit.conf ports: - name: http containerPort: 2020 protocol: TCP livenessProbe: httpGet: path: / port: http readinessProbe: httpGet: path: /api/v1/health port: http volumeMounts: - name: varlog mountPath: /var/log - name: varlibdockercontainers mountPath: /var/lib/docker/containers readOnly: true - name: journal mountPath: /journal readOnly: true - name: fluent-bit-config mountPath: /fluent-bit/etc/conf env: - name: FLUENT_USER valueFrom: secretKeyRef: name: fluent-bit-secrets key: username - name: FLUENT_PASS valueFrom: secretKeyRef: name: fluent-bit-secrets key: password volumes: - name: varlog hostPath: path: /var/log - name: journal hostPath: path: /var/log/journal - name: varlibdockercontainers hostPath: path: /var/lib/docker/containers - name: fluent-bit-config configMap: name: fluent-bit-config tolerations: - key: node-role.kubernetes.io/master effect: NoScheduleCreate a small test application to produce some sample logs. For this example, we will deploy a NGINX webserver:
apiVersion: v1kind: PersistentVolumeClaimmetadata: name: my-pvcspec: accessModes: - ReadWriteOnce resources: requests: storage: 1Gi # Request 1 Gigabyte of storageapiVersion: apps/v1kind: Deploymentmetadata: name: nginx-deploymentspec: replicas: 3 selector: matchLabels: app: nginx template: metadata: labels: app: nginx spec: containers: - name: nginx image: nginx:latest ports: - containerPort: 80 volumeMounts: - name: data mountPath: /usr/share/nginx/html resources: limits: memory: "256Mi" cpu: "200m" requests: memory: "128Mi" cpu: "100m" livenessProbe: httpGet: path: / port: 80 initialDelaySeconds: 15 periodSeconds: 10 readinessProbe: httpGet: path: / port: 80 initialDelaySeconds: 5 periodSeconds: 5 volumes: - name: data persistentVolumeClaim: claimName: my-pvcNext, verify that your deployed pods are running successfully:
$ kubectl get namespacesNAME STATUS AGEdefault Active 6dkube-logging Active 4d3hkube-node-lease Active 6dkube-public Active 6dkube-system Active 6d
$ kubectl get pods -n kube-loggingNAME READY STATUS RESTARTS AGEfluent-bit-c9b8d 1/1 Running 0 23h
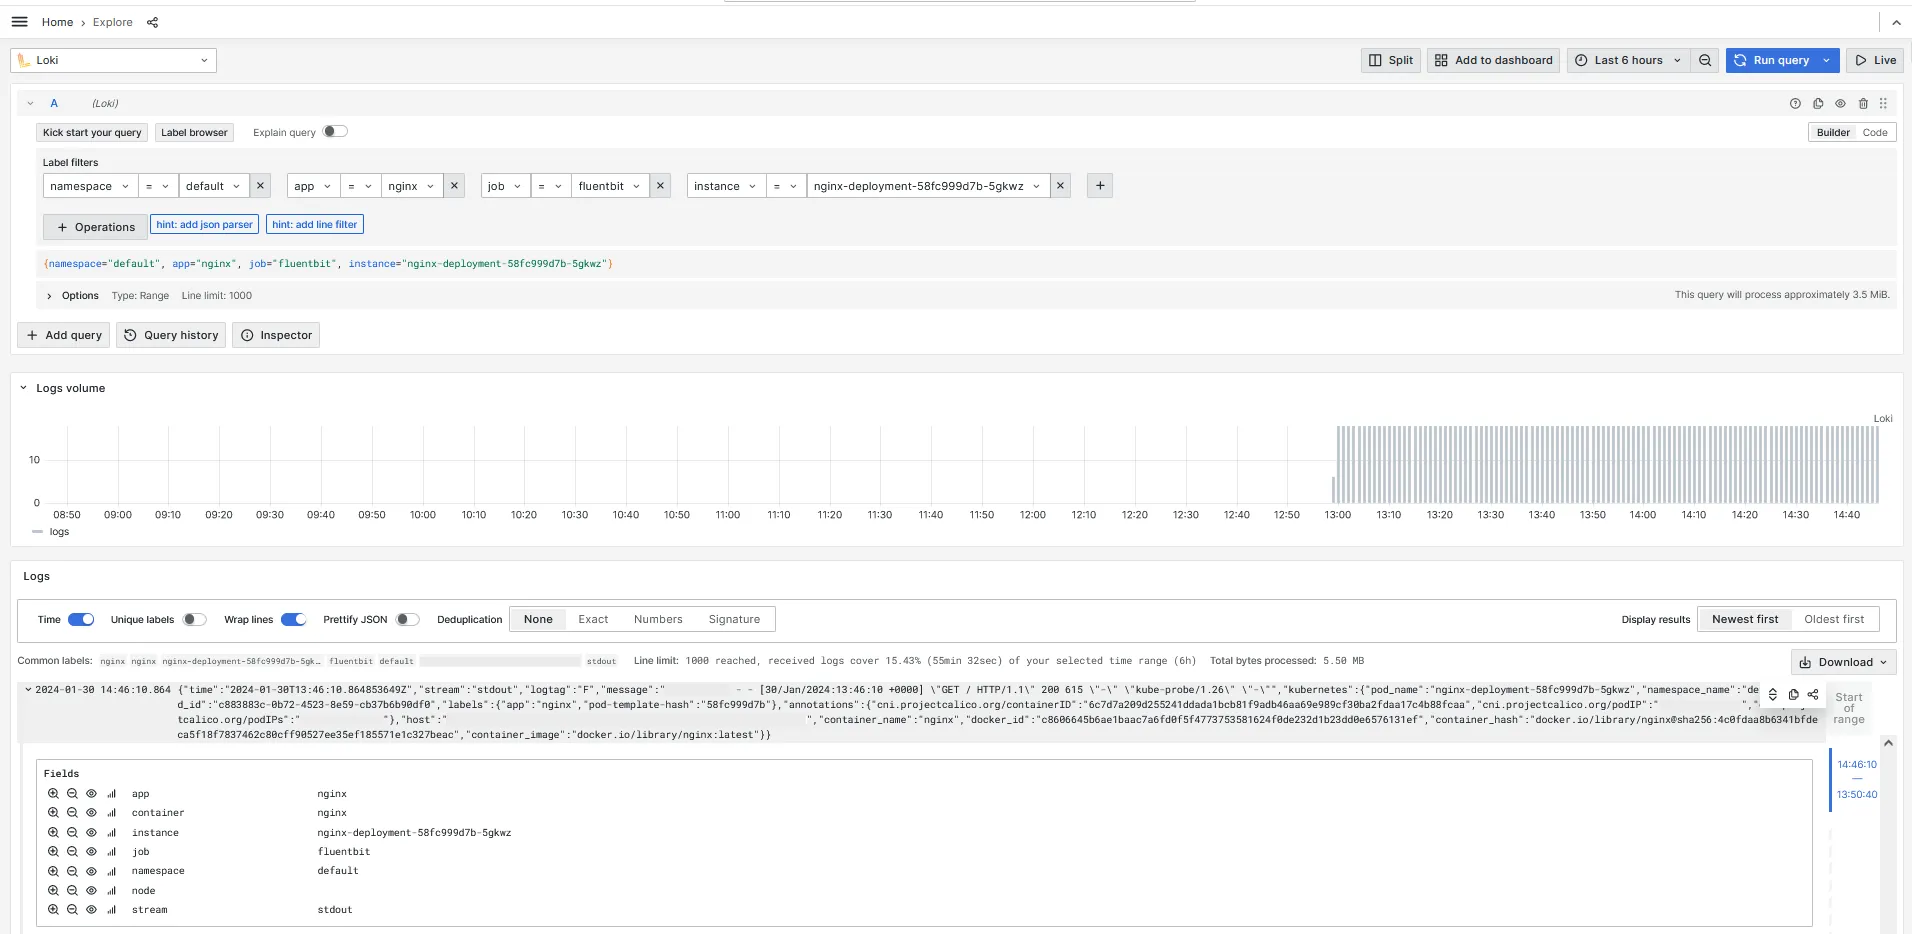
$ kubectl get pods -n defaultNAME READY STATUS RESTARTS AGEnginx-deployment-58fc999d7b-56jrq 1/1 Running 0 9m2snginx-deployment-58fc999d7b-5gkwz 1/1 Running 0 9m2snginx-deployment-58fc999d7b-gxbfr 1/1 Running 0 9m2sOnce everything is running, open Grafana and use the Loki data source to confirm that your logs are arriving:
References
Section titled “References”- fluentbit and Kubernetes
- fluentbit Loki output
- fluentbit helm-charts (use fluent-bit-0.43.0 or higher)
- fluentbit docker image (use 2.2.2 or higher)