Create your first Telemetry Router instance, connect it with Logs and query your audit data
Last updated on
Prerequisites
Section titled “Prerequisites”- You have a STACKIT customer account: Create a customer account
- You have a STACKIT user account: Create a user account
- You have a STACKIT project: Create a project
Prepare, order and create an instance
Section titled “Prepare, order and create an instance”In this guide you will create an instance of the Telemetry Router itself and one STACKIT Logs instance. You will use the latter as OLTP target. This guide shows the most common settings to get started. For a productive environment you may need to adapt some settings. By working through this guide, you will stick to the STACKIT Portal. There are many other ways to manage instances. For a deeper understanding, consult Create and manage instances of Telemetry Router.
Create and configure a STACKIT Logs instance
Section titled “Create and configure a STACKIT Logs instance”To have a destination for your log-stream, we create a STACKIT Logs instance. In a real-world scenario you can choose whatever target you want. Read Create and manage destinations of Telemetry Router to get more information about possible targets, supported protocols and their configuration.
-
Visit the STACKIT Portal.
-
On the sidebar click on Logs.
-
On the bar on the top click on Create Logs.
-
In the overlay just enter a Log name and click on Order fee-based. You don’t need to change the other settings to achieve the goal of this tutorial.
-
After the instance has reached its Active status, open it by clicking on its entry to get into the Overview section.
-
Copy the instance ID to a safe location. You need it later. You find the instance ID on the “General information” pane.
-
Copy the Ingest and the Query range URL to safe location. You find both information by clicking on API on the left pane.
-
Create an access token and copy it to a safe location. On the bar on the left, click on Access tokens. On the new page click on Create access token.
On the pane, enter a name for your token. You can freely choose it. In the Role-dropdown select **Read and Write” and click on Create. After clicking on create, copy the Token to a save location. If you loose it, you need to create a new token.
Now, you have a running STACKIT Logs instance with all credentials and information you need to use it in combination with Telemetry Router.
Create and configure your STACKIT Telemetry Router instance
Section titled “Create and configure your STACKIT Telemetry Router instance”In this sub-chapter you create and configure the actual Telemetry Router instance and add a project-level link.
Create your instance and generate an access token.
Section titled “Create your instance and generate an access token.”-
Visit the STACKIT Portal.
-
On the sidebar click on Telemetry Router.
-
On the bar on the top click on Create Telemetry Router.
-
In the overlay enter a Router name and click on Create.
-
When the status of your instance is
ACTIVE, on the sidebar, click on Access Token. -
Click on Create access token.
-
On the new pane, fill in all needed information: Enter a meaningful name and click on unlimited lifetime. Then click on create. Copy your token to a secure location. Also save the ID of your Telemetry Router to a safe location.
Create a link to your instance
Section titled “Create a link to your instance”-
On the top-left corner, click on the STACKIT logo to access the top level of the portal.
-
On the sidebar, click on Telemetry Links.
-
Click on Create Telemetry Link.
-
On the pane, fill in all needed information: Fill in the ID and the access token from the Telemetry Router instance creation. Then, click on Create.
Configure your STACKIT Telemetry Router instance
Section titled “Configure your STACKIT Telemetry Router instance”To make any changes to your instance, you need to select it. In the sidebar click on Telemetry Router and then on your newly created instance. Then the overview page of your instance will be displayed.
Create a destination and point to your STACKIT Logs instance
Section titled “Create a destination and point to your STACKIT Logs instance”-
On the sidebar click on Destinations.
-
Click on Create destination.
-
In the popup you need to enter a name.
-
As Type select OpenTelemetry.
-
Click on Next to reach the second step.
-
Stick to the pre-defined Bearer token setting, fill in URI and the actual Bearer token.
The URI is the Ingest-URI you copied from your STACKIT Logs instance. The Bearer token is the access token you created a step earlier.
-
Click on Create.
Trigger an auditable event
Section titled “Trigger an auditable event”One can think that you need to trigger an auditable event, that can be queried, then. But with creating a destination for your Telemetry Router instance, you already triggered an event.
Query your STACKIT Logs instance to receive the stored audit logs
Section titled “Query your STACKIT Logs instance to receive the stored audit logs”To query your audit logs you need a client, that is capable of doing GET requests with configurable headers. In this guide we use Postman.
Use the Query range-URI you saved before as a start. In this guide we show the principle with a sample instance. It has the ID 851585dd-bbeb-42ad-afa1-e42e18ff72d8. This results in the following base URI: https://851585dd-bbeb-42ad-afa1-e42e18ff72d8.logs.eu01.onstackit.cloud/loki/api/v1/query_range.
Queries to STACKIT Logs always need a non-empty query parameter. Due to the fact, that all audit objects have a service_name key, we filter for every possible occurrence of it. The expression is: {service_name=~".+"}. To circumvent encoding issues, we provide an encoded version: %7Bservice_name%3D~%22.%2B%22%7D. The final URI for query your audit objects is:
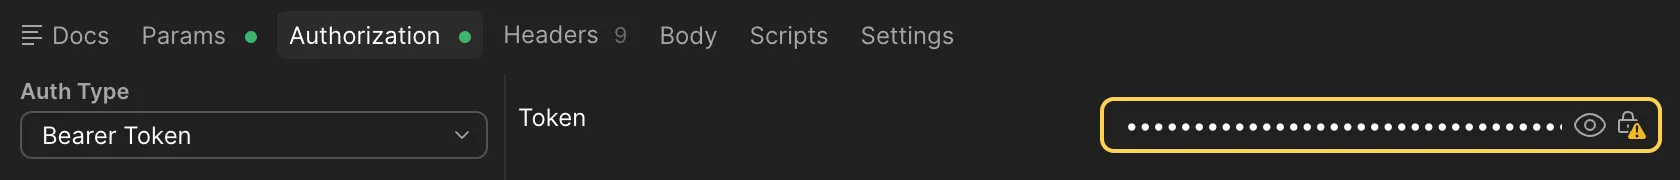
https://851585dd-bbeb-42ad-afa1-e42e18ff72d8.logs.eu01.onstackit.cloud/loki/api/v1/query?range?query=%7Bservice_name%3D~%22.%2B%22%7DTo authenticate Postman with its query against STACKIT Logs, you need to add the Bearer token to the header. In Postman, click on the Authorization tab and in the Auth Type-dropdown select Bearer Token. Paste the STACKIT Logs access token, you saved earlier, into the field on the right.
The server answers with a JSON object. It looks similar to the screenshot:
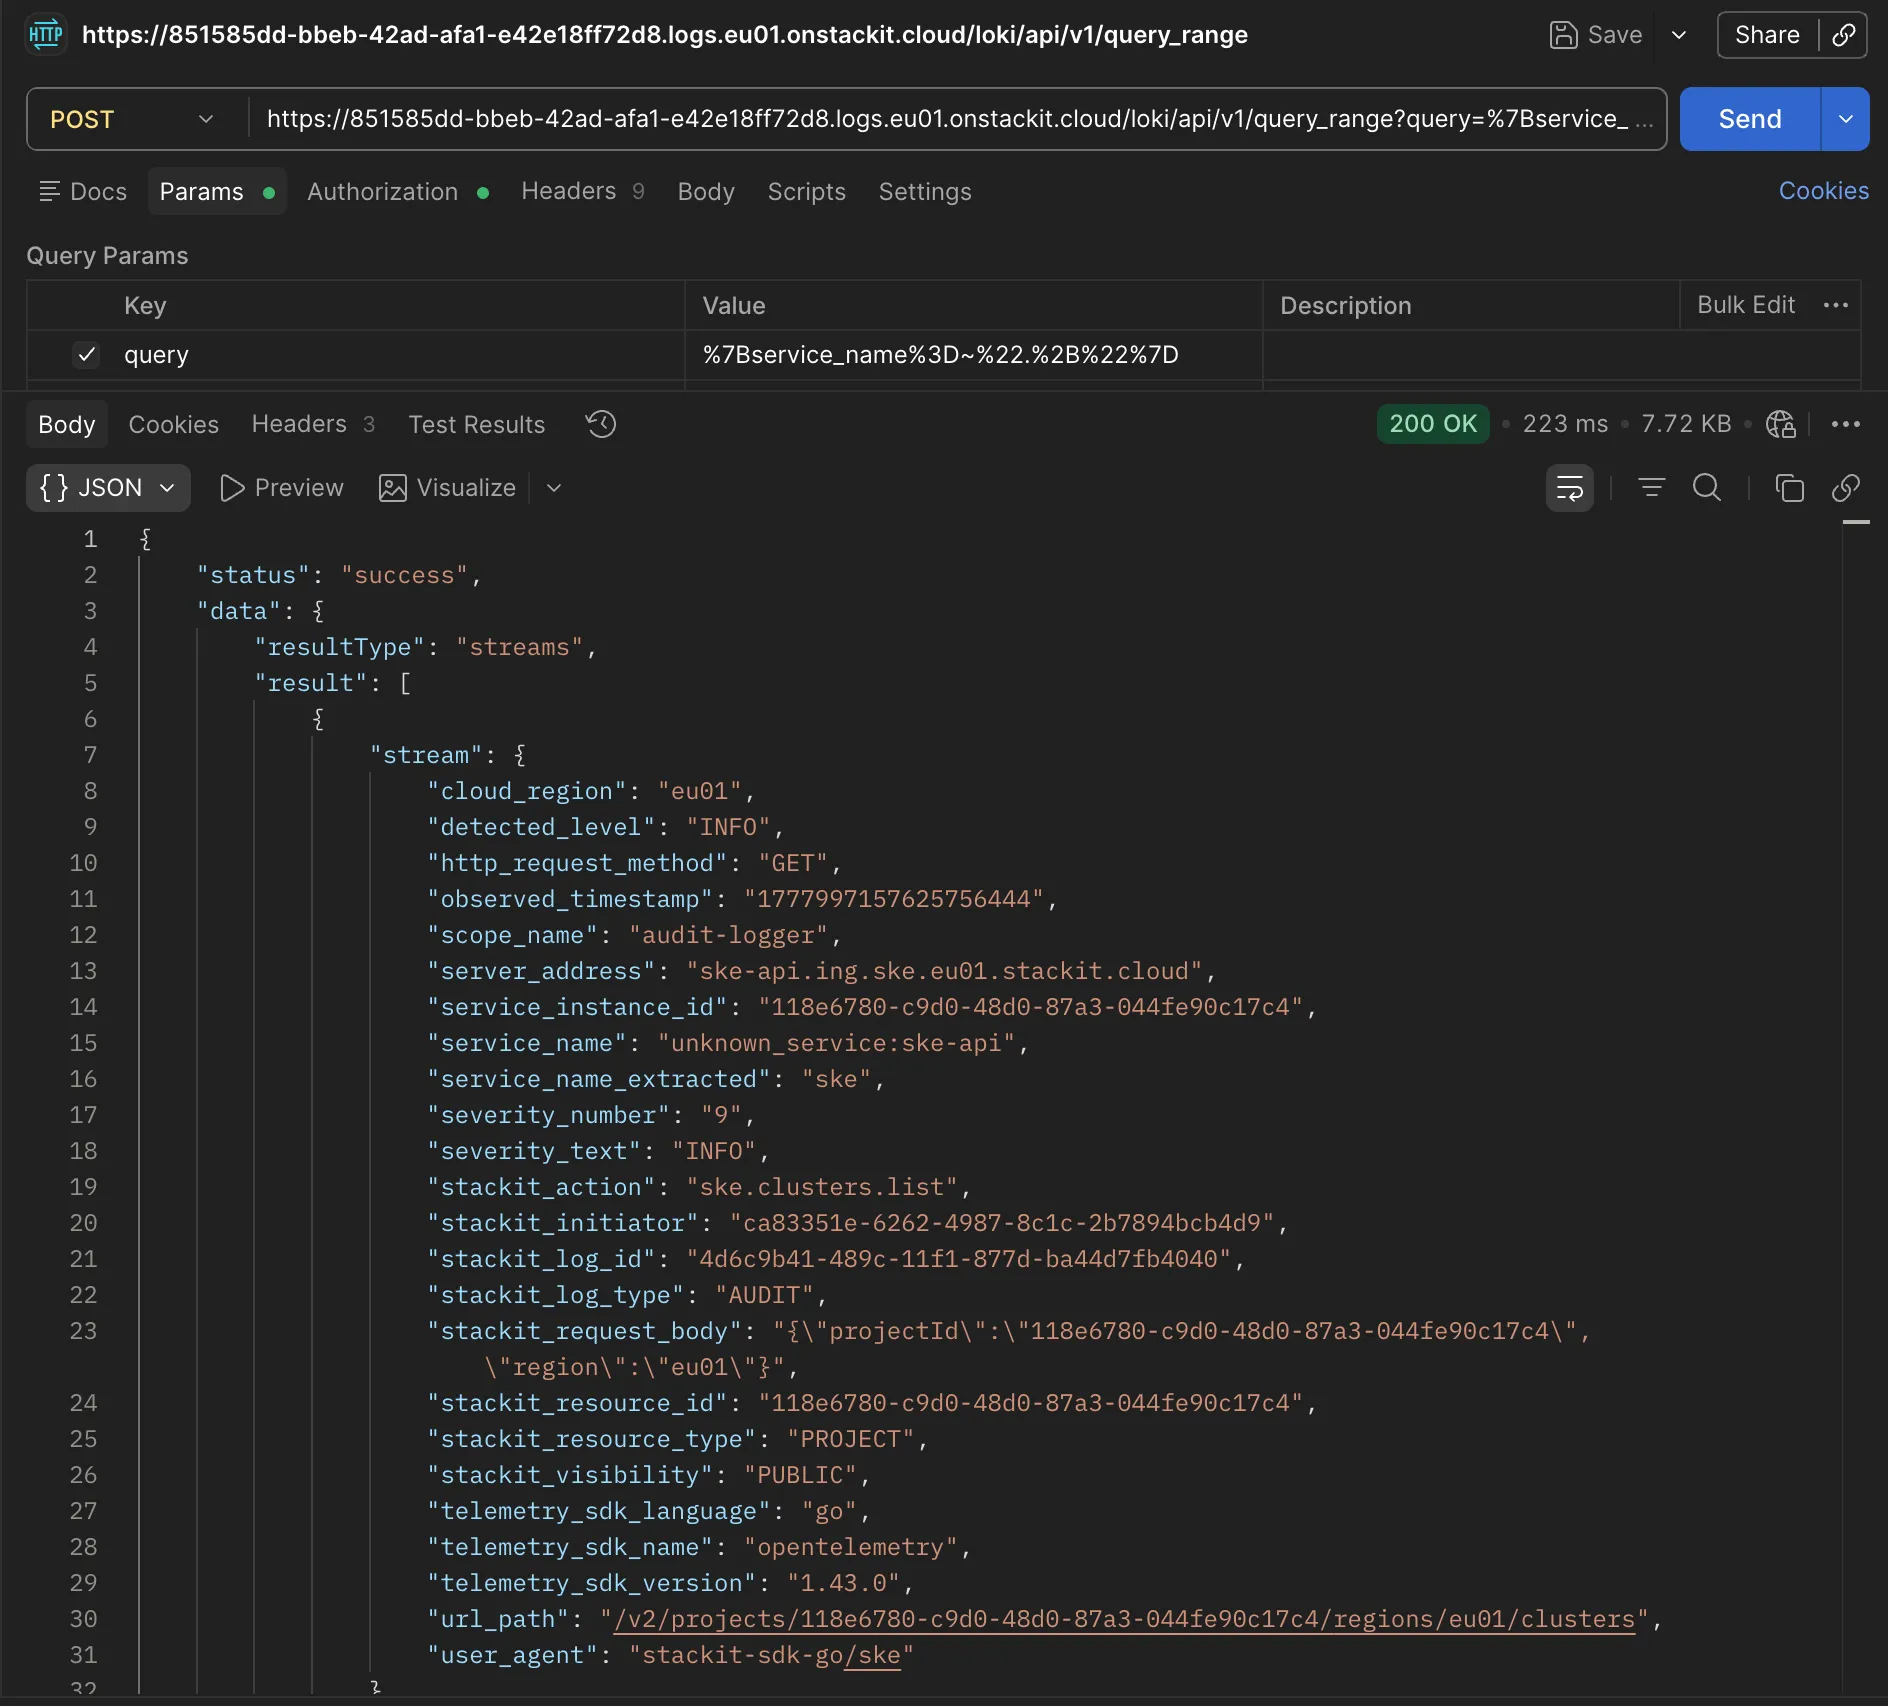
You find the actual audit log entries within an array called result. Here you can find one sample entry in this array, that embodies an audit event.
{ "stream": { "cloud_region": "eu01", "detected_level": "INFO", "http_request_method": "GET", "observed_timestamp": "1777997157625756444", "scope_name": "audit-logger", "server_address": "ske-api.ing.ske.eu01.stackit.cloud", "service_instance_id": "118e6780-c9d0-48d0-87a3-044fe90c17c4", "service_name": "unknown_service:ske-api", "service_name_extracted": "ske", "severity_number": "9", "severity_text": "INFO", "stackit_action": "ske.clusters.list", "stackit_initiator": "ca83351e-6262-4987-8c1c-2b7894bcb4d9", "stackit_log_id": "4d6c9b41-489c-11f1-877d-ba44d7fb4040", "stackit_log_type": "AUDIT", "stackit_request_body": "{\"projectId\":\"118e6780-c9d0-48d0-87a3-044fe90c17c4\",\"region\":\"eu01\"}", "stackit_resource_id": "118e6780-c9d0-48d0-87a3-044fe90c17c4", "stackit_resource_type": "PROJECT", "stackit_visibility": "PUBLIC", "telemetry_sdk_language": "go", "telemetry_sdk_name": "opentelemetry", "telemetry_sdk_version": "1.43.0", "url_path": "/v2/projects/118e6780-c9d0-48d0-87a3-044fe90c17c4/regions/eu01/clusters", "user_agent": "stackit-sdk-go/ske" }, "values": [["1777997157625750313", "ListClusters"]]}Now you have got an overview of audit logging. From here on you may want to get more information from one of the how-tos. Read Create and manage instances of Telemetry Router, Create and manage destinations of Telemetry Router or Create and manage links of Telemetry Router to learn more about the product.